The EPA is interested in quantifying what future particulate matter (PM) concentrations might be in the future. In the U.S. intermountain west both extreme PM events and background PM concentrations are closely linked to wildfire activity. Once you start digging through fire science or air quality literature you don't get far before someone mentions the expectation that wildfire occurrence and area will increase with climate change. This of course makes sense, as the West warms and dries it is perfectly reasonable to expect the number of wildfires to increase (and this has been shown in many studies). However, humans have a much more direct and complicated relationship with fire than warming the planet by pumping green house gasses into the atmosphere. Other major ways we interact with fires include: 1) Fighting them. Depending on where a fire is located we don't let them burn without a fight. 2) Land management including fuel reduction, logging activity, and controlled burns. 3) We start them! There are of course other ways we interact with fire and earth system but I want to focus on the third one I just mentioned. Humans start a lot of fires. How many fires? I decided to take a look at the data to start to get an idea of what the human contribution is.
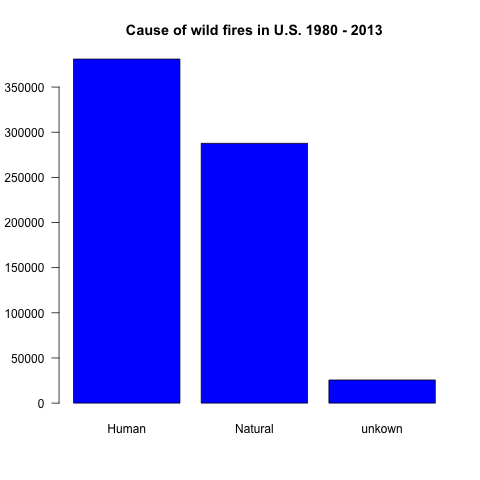
This clearly shows that humans do our fair share or starting fires. Smokey the Bear must be devastated. This figure includes all 50 states in the U.S. If we subset the data to include only western states it seems likely that Natural could start to close the gap with humans.
We have seen that humans start a lot of fires, more than nature does. How many acres of burned land are we responsible for?
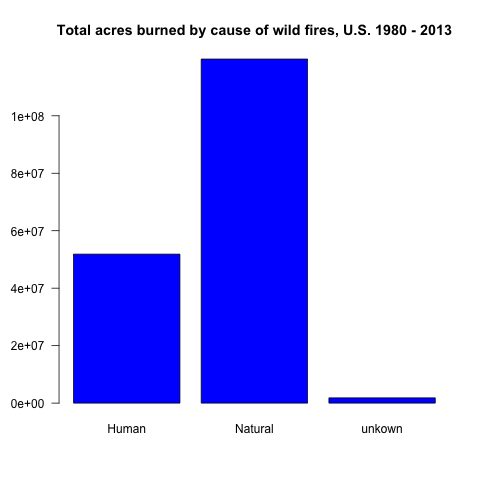
I was hoping humans weren't going to be the leader in this category as well. These two figures combined seems to suggest that humans start a lot of fires but the fires we do start are generally small. It is also possible that a small number of fires for each start type account for a large fraction of total burned area.
Lets transition to looking at only western states. The states included in the following plots are Washington, Idaho, Nevada, Utah, California,
Montana, Oregon, Colorado, and Wyoming. First lets reproduce the two plots limited to data from these states.
Montana, Oregon, Colorado, and Wyoming. First lets reproduce the two plots limited to data from these states.
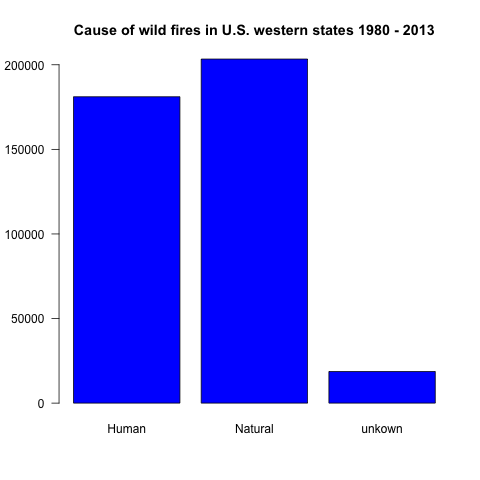
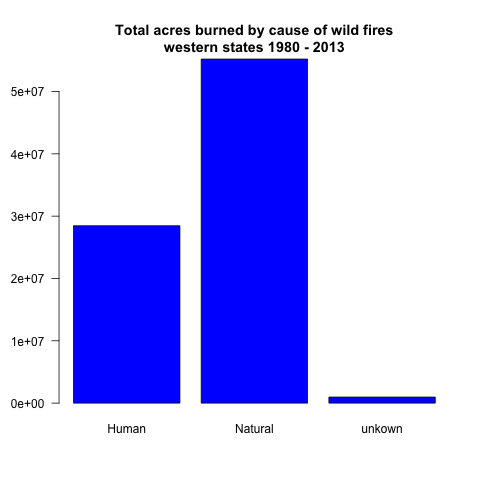
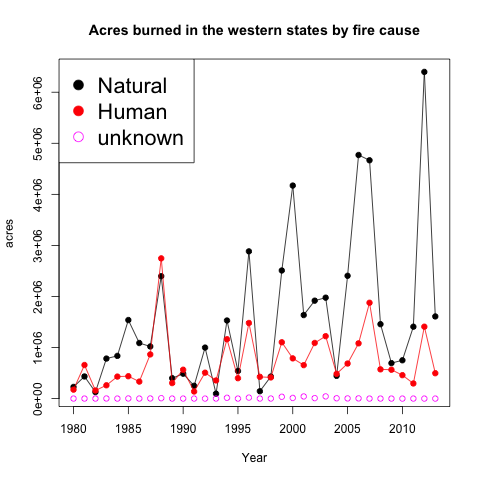
In the western states there are more natural causes of fires than humans. This makes sense now that we are in the more arid, mountainous part of the country, where there are far fewer people than the more densely populated eastern States. The area burned by natural fires is about double that of human started fires. What do the burn area totals look like if we look at the data on an annual basis?
Lets look at the exact same data but in cumulative form.
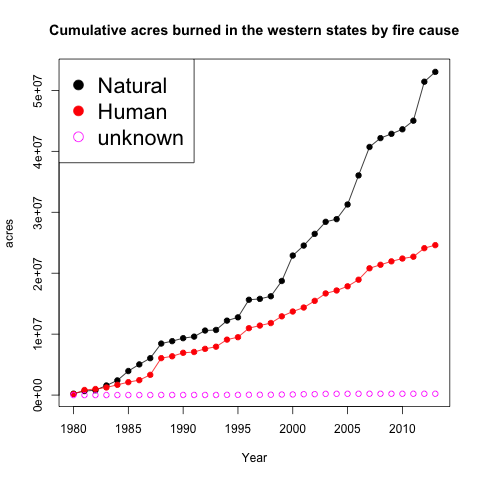
The take home message is humans are responsible four A LOT of burning. When worrying about future PM emissions from fire it seems inappropriate to focus purely on the impact of climate change. Fires started by humans should be considered low hanging fruit in any effort to reduce burn area and the (somewhat) proportional emissions that follow.
R code and data used to make plots provided below
# load libraries
library(ggplot2)
library(sp)
library(rgdal)
library(rgeos)

# Data : http://wildfire.cr.usgs.gov/firehistory/data/fh_all.zip
# metadata : http://wildfire.cr.usgs.gov/firehistory/data.html

# Download the data
localDir <- getwd()
url <- 'http://wildfire.cr.usgs.gov/firehistory/data/fh_all.zip'
file <- paste(localDir, basename(url),sep='/')
if (!file.exists(file)) {
 download.file(url, file)
 unzip(file,exdir=localDir)
}

# create a layer name for the shapefiles (text before file extension)
layerName <- "firehistory_1980_2013_allagencies"

localDir <- "firehistory_1980_2013_allagencies"
# read data into a SpatialPolygonsDataFrame object
dataProjected <- readOGR(dsn=localDir, layer=layerName)

# Could use names(data_projected@data) or just:
names(dataProjected)

# Ok lets find out what burn area can be attributed to each of the start types
# first lets show the three catigories total count
cause <- dataProjected$CAUSE
naturalMask <- cause == "Natural"
humanMask <- cause == "Human"
NAMask <- is.na(cause)

nNatural <- sum(naturalMask, na.rm=TRUE)
nHuman <- sum(humanMask, na.rm=TRUE)
nNA <- sum(NAMask)

png(filename="fireStart.png")
par(las=1)
height = c(nHuman,nNatural,nNA)
barplot(height,
 names.arg=c("Human","Natural","unkown"),
 col="blue")
title("Cause of wild fires in U.S. 1980 - 2013")
dev.off()


burnArea <- dataProjected$TOTALACRES
humanArea <- sum(burnArea[humanMask], na.rm=TRUE)
naturalArea <- sum(burnArea[naturalMask], na.rm=TRUE)
NAArea <- sum(burnArea[NAMask], na.rm=TRUE)

png(filename="burnAreaAttributed.png")
par(las=1)
height = c(humanArea,naturalArea,NAArea)
barplot(height,
 names.arg=c("Human","Natural","unkown"),
 col="blue")
title("Total acres burned by cause of wild fires, U.S. 1980 - 2013")
dev.off()


# TODO: Show these catigories as total by year over time


# The next natural step is to do the same thing only for a subset of states we
# are interested in

# states of interest, we want to create a mask where dataProjected is TRUE
# for any of these states
states <- dataProjected$STATE
statesOfInterest <- c("Washington","Idaho","Nevada","Utah","California",
 "Montana","Oregon","Colorado","Wyoming")

stateMask <- rep(FALSE,length(states))
for (state in statesOfInterest){
 stateMask[state == states] <- TRUE
}


dataProjectedSubset <- dataProjected[stateMask, ]


# Ok lets find out what burn area can be attributed to each of the start types
# first lets show the three catigories total count
cause <- dataProjectedSubset$CAUSE
naturalMask <- cause == "Natural"
humanMask <- cause == "Human"
NAMask <- is.na(cause)

nNatural <- sum(naturalMask, na.rm=TRUE)
nHuman <- sum(humanMask, na.rm=TRUE)
nNA <- sum(NAMask)

png(filename="fireStartWest.png")
par(las=1)
height = c(nHuman,nNatural,nNA)
barplot(height,
 names.arg=c("Human","Natural","unkown"),
 col="blue")
title("Cause of wild fires in U.S. western states 1980 - 2013")
dev.off()


burnArea <- dataProjectedSubset$TOTALACRES
humanArea <- sum(burnArea[humanMask], na.rm=TRUE)
naturalArea <- sum(burnArea[naturalMask], na.rm=TRUE)
NAArea <- sum(burnArea[NAMask], na.rm=TRUE)

png(filename="burnAreaAttributedWest.png")
par(las=1)
height = c(humanArea,naturalArea,NAArea)
barplot(height,
 names.arg=c("Human","Natural","unkown"),
 col="blue")
title("Total acres burned by cause of wild fires")
title(line=0.5, "western states 1980 - 2013")
dev.off()

# loop through years to see how area burned can be attributed over time
endDate <- as.POSIXlt(dataProjectedSubset$OUTDATED, format="%Y/%m/%d")

naturalAreaBurned <- rep(NA, length(1980:2013))
humanAreaBurned <- rep(NA, length(1980:2013))
NAAreaBurned <- rep(NA, length(1980:2013))

# Loop through and count total area burned for each
years <- 1980:2013
for (i in 1:length(years)){
 year <- years[i]
 yearMask <- (endDate$year+1900) == year

 # count the years total burn by start type
 naturalAreaBurned[i] <- sum(burnArea[naturalMask & yearMask], na.rm=TRUE)
 humanAreaBurned[i] <- sum(burnArea[humanMask & yearMask], na.rm=TRUE)
 NAAreaBurned[i] <- sum(burnArea[NAMask & yearMask], na.rm=TRUE)
}

png(filename="acreasBurnedTimeSeries.png")
par(mgp= c(3, 1, 0))
plot(years, naturalAreaBurned, col="black", pch=19,
 ylab="acres",
 xlab="Year")

lines(years, naturalAreaBurned, col="black")
points(years, humanAreaBurned, col="red", pch=19)
lines(years, humanAreaBurned, col="red")
points(years, NAAreaBurned, col="magenta")

legendText <- c("Natural", "Human", "unknown")
legend("topleft", legend=legendText,
 col=c("black","red", "magenta"),
 pch=c(19,19,1),
 cex=1.8
 )
title("Acres burned in the western states by fire cause")
dev.off()

humanAreaCumulative <- cumsum(humanAreaBurned)
naturalAreaCumulative <- cumsum(naturalAreaBurned)
NAAreaAreaCumulative <- cumsum(NAAreaBurned)

png(filename="acreasBurnedCumulative.png")
par(mgp= c(3, 1, 0))
plot(years, naturalAreaCumulative, col="black", pch=19,
 ylab="acres",
 xlab="Year")

lines(years, naturalAreaCumulative, col="black")
points(years, humanAreaCumulative, col="red", pch=19)
lines(years, humanAreaCumulative, col="red")
points(years, NAAreaAreaCumulative, col="magenta")

legendText <- c("Natural", "Human", "unknown")
legend("topleft", legend=legendText,
 col=c("black","red", "magenta"),
 pch=c(19,19,1),
 cex=1.8
)
title("Cumulative acres burned in the western states by fire cause")
dev.off()
No comments:
Post a Comment